Param
Param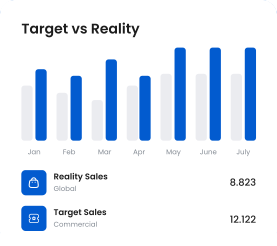
April 10, 2026
Version 1.3.0 - Performance Comparison Dashboard
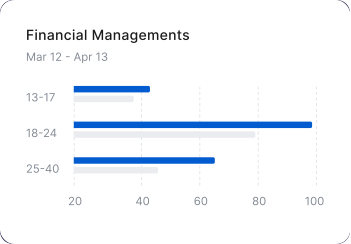
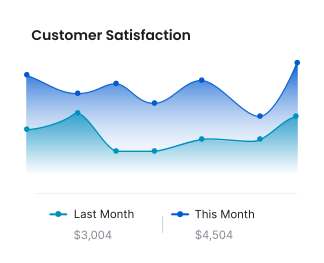
This update introduces a refined performance comparison view designed to help teams evaluate projected results against actual execution more clearly. The new chart presentation improves visibility across multi-point trend data, making it easier to identify performance gaps, growth peaks, and areas that require attention. We also improved the visual balance of the reporting card, polished the chart layering, and enhanced readability so users can review key progress metrics more efficiently during daily workflow analysis.